
The big economic news this week is that retail & food services sales were approximately flat month-over-month, up only 0.1% in May (see Exhibit 1), and revised estimates show April retail sales were -0.2% (revised down from 0.0%).
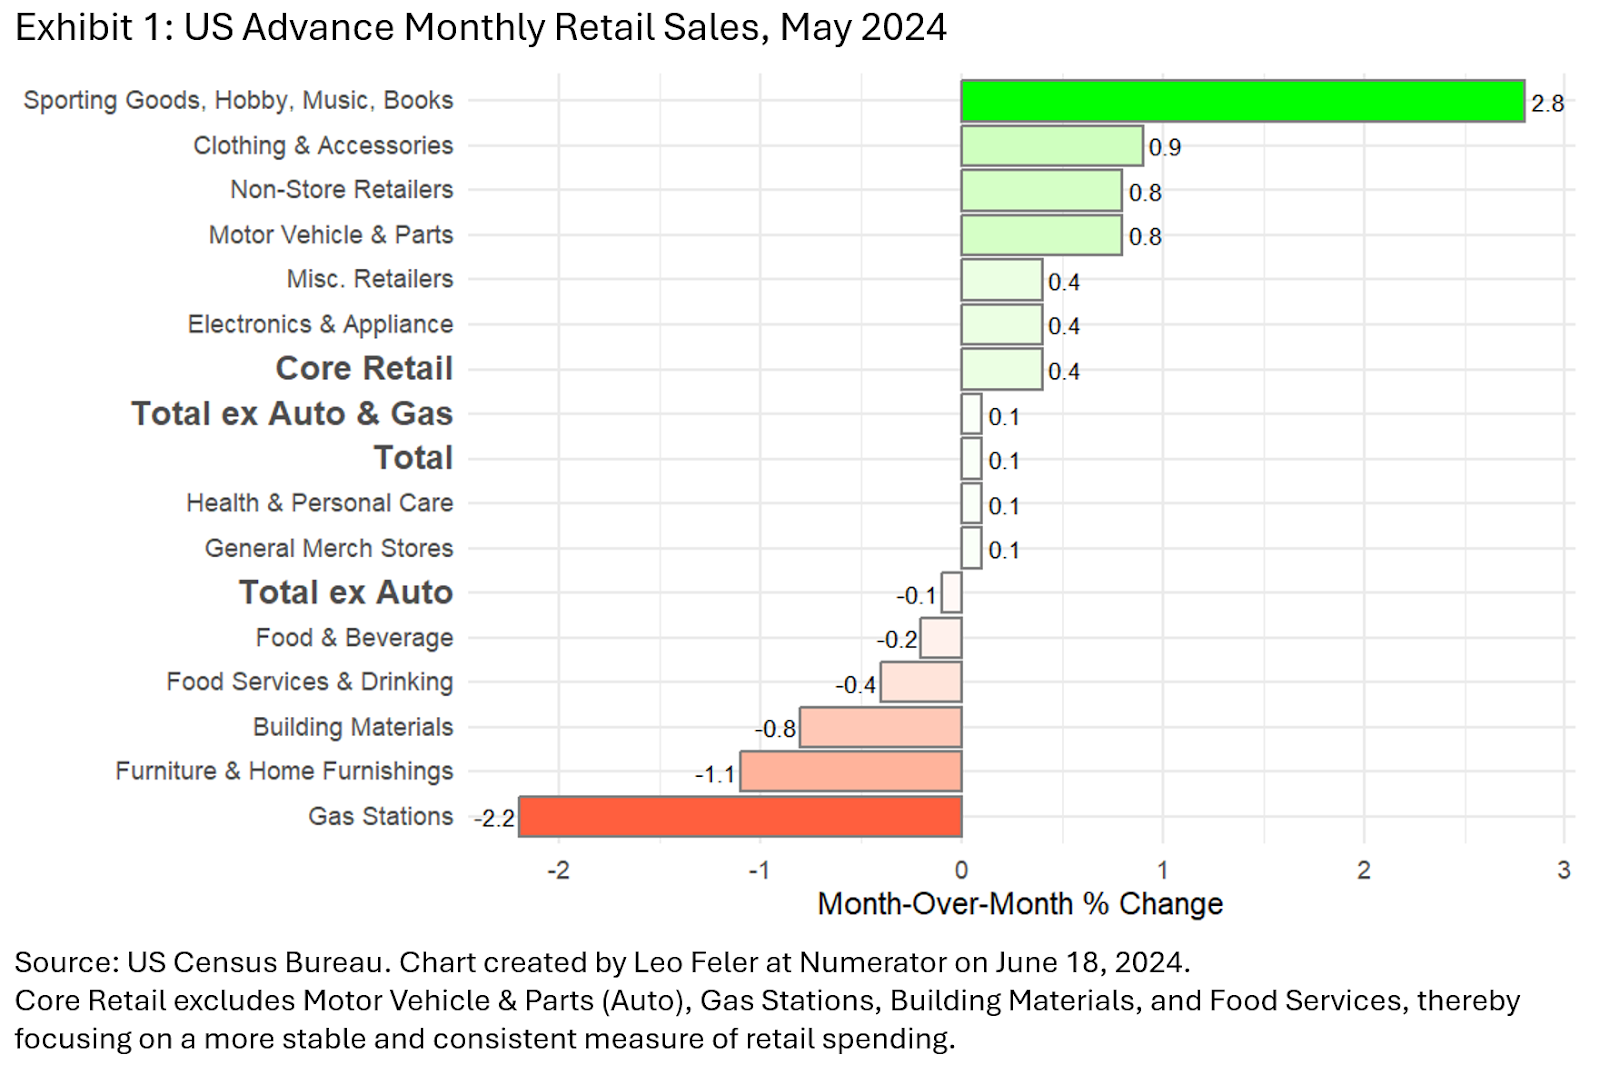
It’s not surprising to see declines for gas stations since gas prices are down. Likewise, mortgage rates are high and the housing market is stalling, so it’s not surprising to see declines in building materials (home improvement stores) and furniture & home furnishings stores. Consumers are showing more restraint with their food spending, pulling back both on food services (restaurants) and grocery store purchases. On the opposite end of the spectrum, consumers are spending more on sports, hobbies, books & music stores than they tend to do this time of year. That’s not just the effect of the start of summer – the data is seasonally adjusted to take into account how we might purchase more or less from particular retailers during different months of the year. Consumers are also spending more on clothing and online shopping.
Does the data show the consumer is pulling back? Let’s dissect.
Where does this data come from? Around the middle of every month, the US Census Bureau releases a report called “Advance Monthly Sales for Retail and Food Services”. The latest report came out on June 18th, looking at what happened in May. There is usually a two-week lag between the end of the reference month (in this case, May) and when the data is released (middle of June).
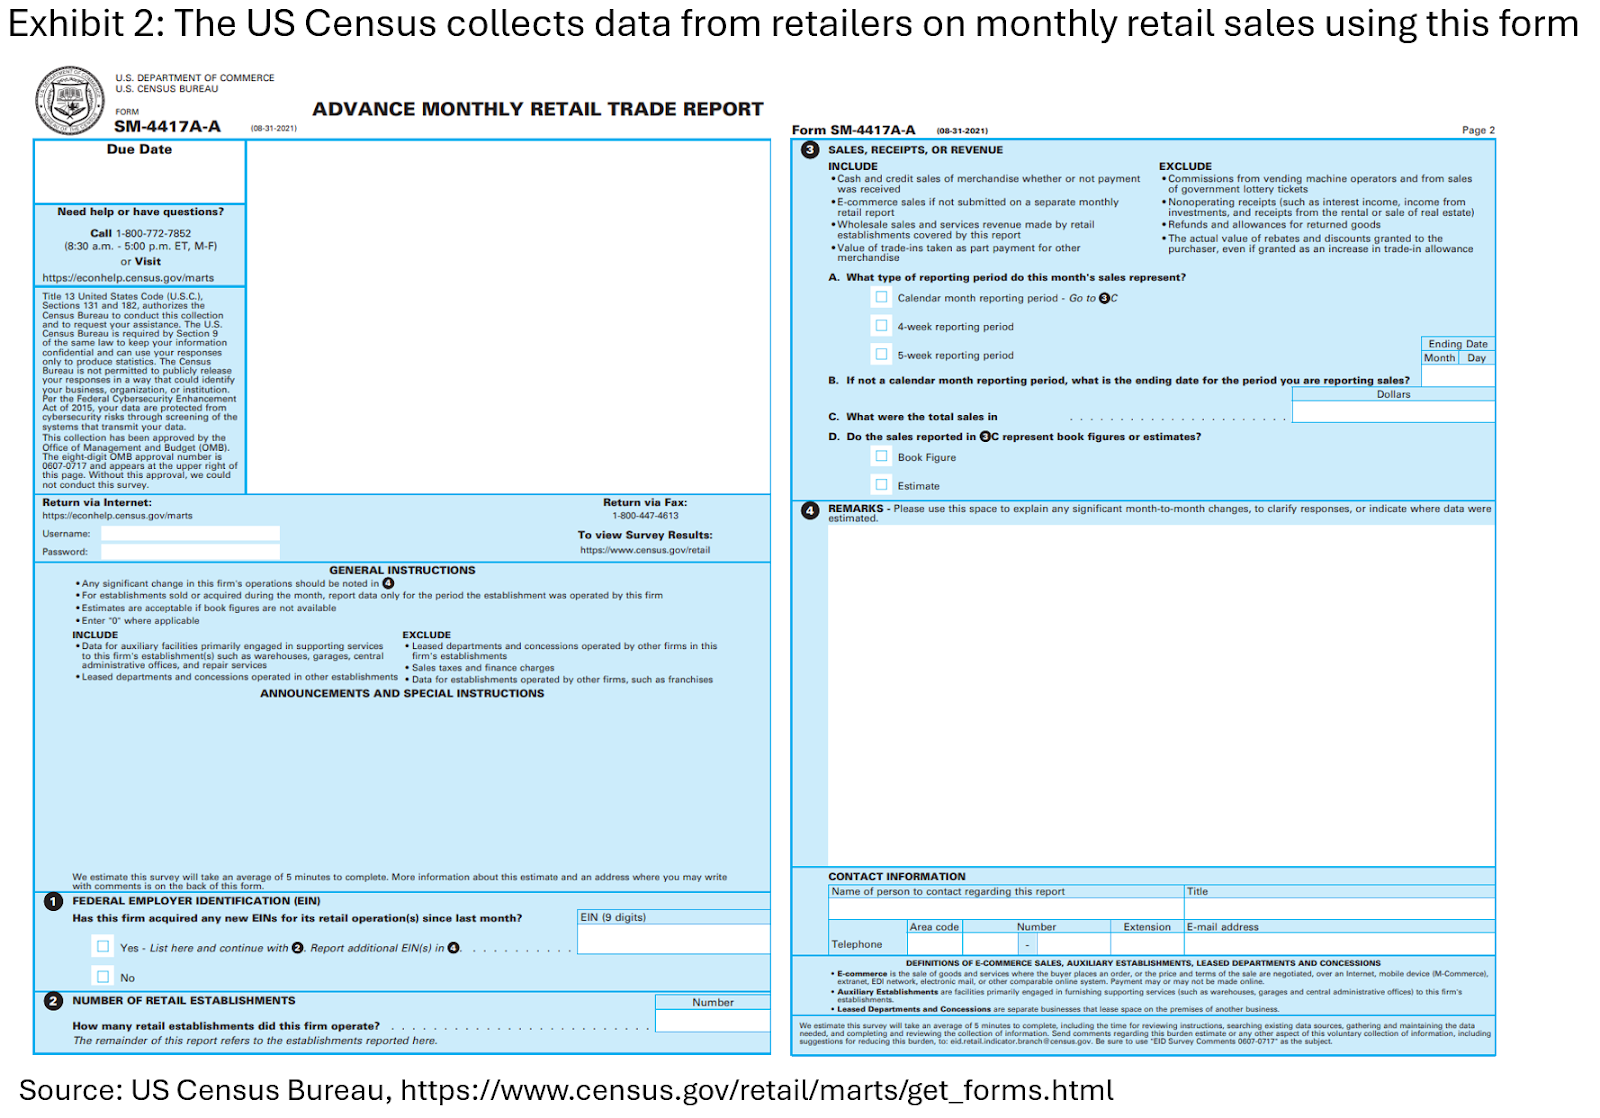
The Census Bureau collects this data directly from a sample of retailers. Retailers get the following two-page form (see Exhibit 2), provide their Federal Employer Identification Number (EIN), the number of retail establishments they operate, and the book figure or estimate of the sales, receipts, or revenue they earned in a month, and then they can submit online, mail or fax the form back (do fax machines still exist?). The Census Bureau aggregates and analyzes this data to publish an advance estimate of monthly retail sales and food services.
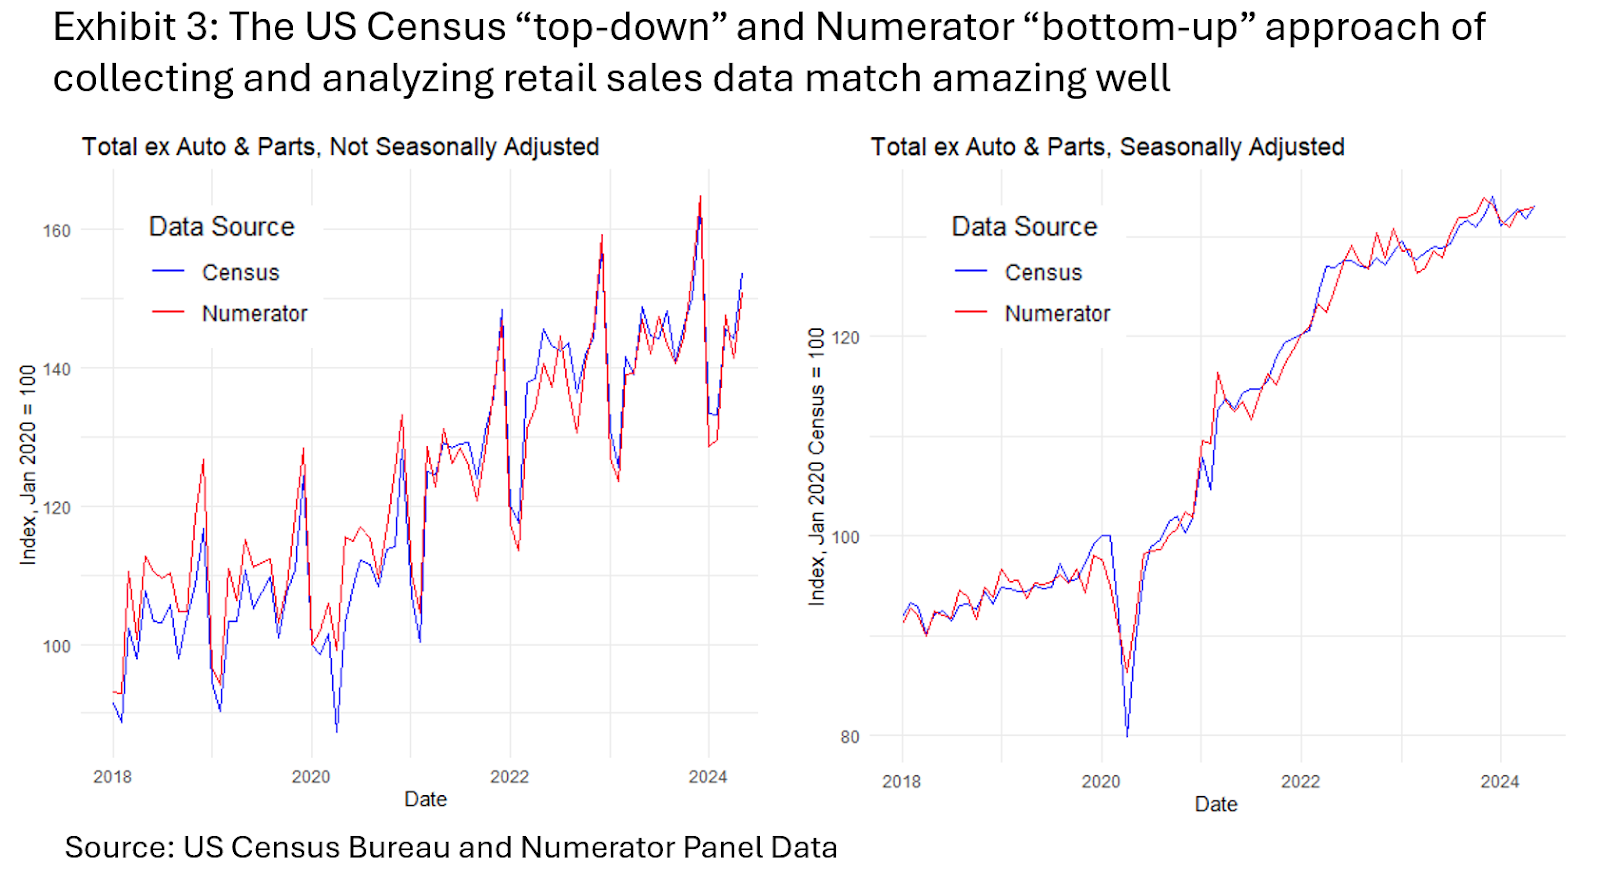
We can think of the Census Bureau methodology as “top-down” – asking retailers how much they sold. But at Numerator, we have another way – “bottom-up” – of collecting this data, by looking at the receipts and transactions of a representative panel of 150,000 US households. The data match amazingly well (see Exhibit 3).
There are multiple benefits of using the Numerator data to analyze retail sales. First, we get it almost in real-time. Every day, we see consumers’ purchases from receipts they submit or accounts they have linked using our app. There is minimal lag between when consumers make purchases and when Numerator can analyze the data. The Federal Reserve Bank of Chicago is now using Numerator data to provide forecasts ahead of the official retail sales releases (see here).
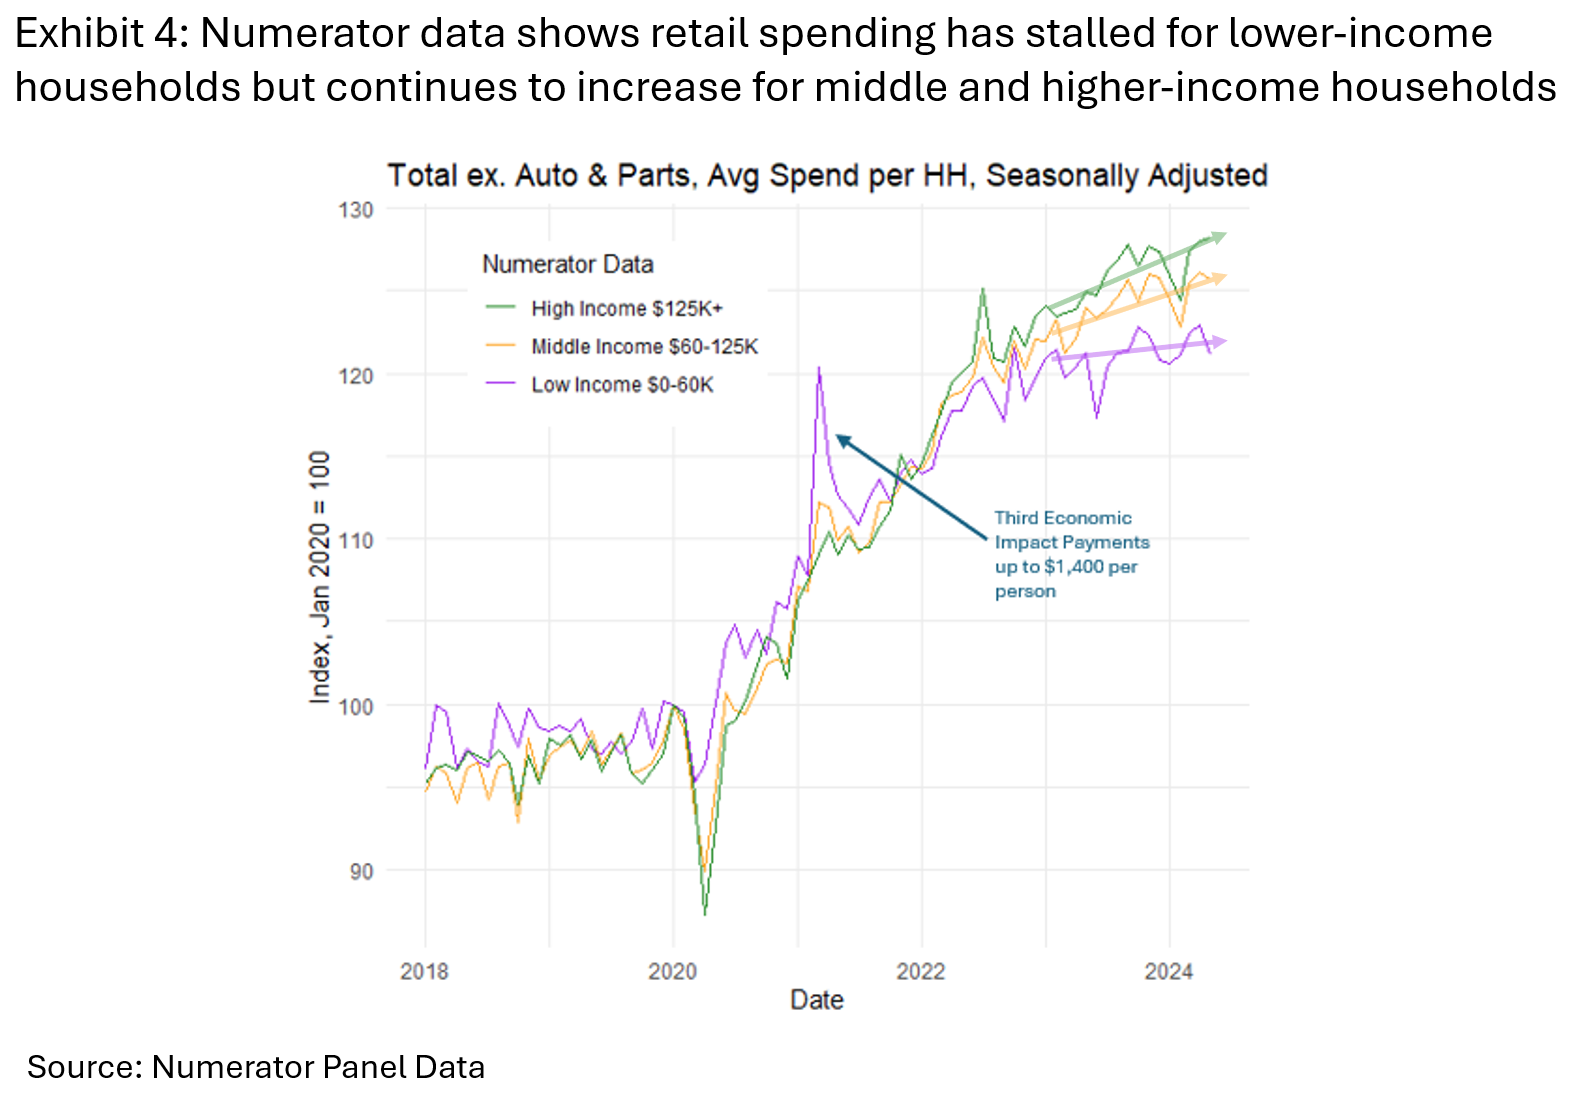
Second, because of Numerator’s “bottom-up” approach, we can see who is doing the shopping – something that is not possible in the Census data, which just obtains aggregates from retailers. That means we can decompose changes in retail sales by income groups, generation, race/ethnicity, and region of the country. For example, we can see in Numerator data that retail spending has flat-lined for lower income households but continues to increase for middle and high-income households (see Exhibit 4).
Third, Numerator can look within retailers to see receipt-level details of what consumers are buying. This is not possible with either the Census data or with alternative data sources like credit card data. Back in the day, if you wanted to buy food, you would go to a grocery store; if you wanted to buy furniture, you would go to a furniture store; and if you wanted to buy clothing, you would go to a clothing store. Now, retailers like Walmart and Target and Costco sell food, furniture, and clothing all in one place. If we truly want to understand how consumers are changing their behaviors, we can’t just look at the store-level anymore; we need to look within stores to see how consumers are changing their purchases of essential versus non-essential items.
Back to our original question: is the consumer pulling back? Not really. Consumers are maintaining a high-level of monthly retail spending. Lower-income consumers are no longer increasing their monthly retail spend, but they’re also not pulling back in any meaningful way. Middle and higher-income consumers continue to increase their monthly retail spend, but they’re doing so more slowly. This is more of a slow down or pause than a pull back.
For next time, rather than following the Census methodology of looking only at the retailer level, we’ll look within retailers to see how consumer purchases are changing. Stay tuned!
